Introduction to Operational Efficiency
Organizations, and in particular, Financial Institutions seek to operate at peak efficiency levels. But what is operations efficiency and what does it mean to be efficient? Investopedia defines Operational Efficiency as follows: “A market condition that exists when participants can execute transactions and receive services at a price that equates fairly to the actual costs required to provide them. An operationally-efficient market allows investors to make transactions that move the market further toward the overall goal of prudent capital allocation, without being chiseled down by excessive frictional costs, which would reduce the risk/reward profile of the transaction.” Basically this definition says that operationally efficient enterprises or endeavors occur when the cost of the services rendered is not overly excessive that it reduces overall profitability of the service. Obviously this speaks to the basic concepts of a business – revenue less expenses should yield a profit. 
For Financial Institutions, it becomes even more important as a fundamental ratio exists that helps us define what operational efficiency should be. This of course is the Efficiency Ratio or the ratio of expenses to revenue. The Efficiency Ratio tells us how much money a financial institution spends to churn every dollar of revenue. If a bank or credit union has an Efficiency Ratio of .75, we can make the assumption that this FI spends 75 cents to help create every dollar of revenue it earns. And, if we then compare this institution against its peers, we can obtain a relative sense of how efficient one FI is versus another FI. A word of caution about Efficiency Ratios though is that we need to be careful that when comparing them within the industry or across peers we have a true “apples-to-apples” comparison. In doing research on this topic, I discovered that there are at least 4 ways that an Efficiency Ratio can be calculated:
- Non-interest expense divided by total revenue less interest expense
- Non-interest expense divided by net interest income before provision for loan losses
- Non-interest expense divided by revenue
- Operating expenses divided by fee income plus tax-equivalent net interest income
When I compare Efficiency Ratios, I will often use either the FDIC or NCUA call report statistics which uses a standard defined formula for calculating this ratio across all organization in their databases. This provides the ability to get as close to an “apples-to-apples” comparison without having to go into each FI’s annual reports and breaking it down in exactly the same manner each time. But, no matter how an organization calculates this rate, the premise is the same for everyone – the lower the number, the more efficient your organization is. From an industry perspective, generally any organization that is in the range of about .64 to .67 is considered to be an efficient organization. Above this number, and an FI should be trying to find ways to improve their efficiency. Of course, the question then becomes “How do we go about improving this number?” Is it a factor purely reducing expenses, increasing revenue, or perhaps doing some of both? The answer really depends on a number of factors that are impacting the bank, but in general, attacking both the revenue and cost side together is very prudent.
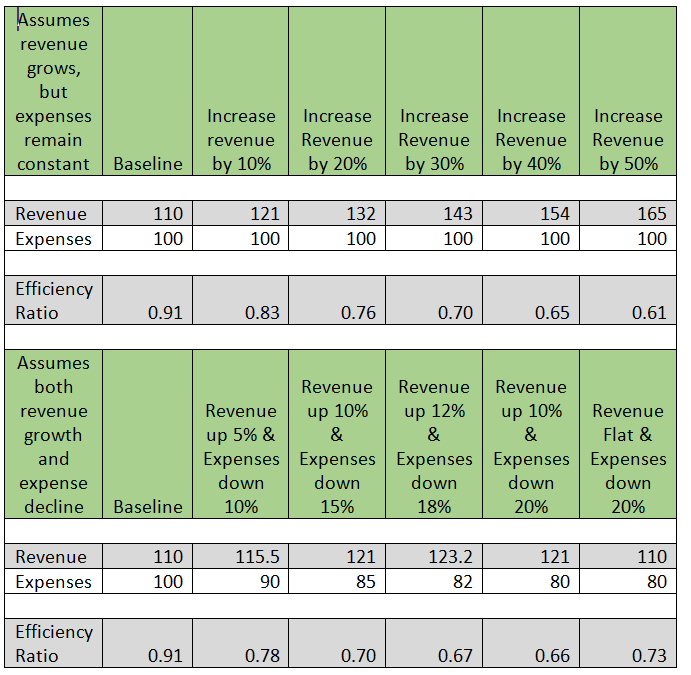
To demonstrate this, let’s talk about two hypothetical FIs who are located in the same geographic area and compete with each other for business. For simplicity sake, we will call them Bank A and Bank B. In our example, one of Bank A’s board members has raised an issue about the Efficiency Ratio of the bank with management. Both banks use equation number 3 above to calculate their Efficiency Ratios and for Bank A we have revenue of 110 and expenses of 100. This yields an efficiency ratio of .91. The board member is concerned because Bank B has an efficiency ratio of .66. Bank A management looks at some of the numbers for Bank B and realizes that they have revenue that is about 10% higher than theirs or at 121. And since the banks are of a similar size and in the same competing markets, Bank A makes the assumption that costs must be similar in both banks, so if Bank A can improve their revenue by 10% and hold costs steady, they would be able to improve their efficiency ratio to be more competitive with Bank B. Bank A’s strategy in the coming year is to increase revenue to match Bank B. Let’s make the assumption that at the end of the year, Bank A and Bank B both have revenue of 121. However, when Efficiency Ratios are compared, Bank A did improve from .91 to .83, but Bank B has maintained its ratio at .66. Bank A now realizes that despite the same market conditions, somehow Bank B has lower expenses than Bank A. In reality, Bank B has expenses of 80 or about 20% less than Bank A. At their current cost structure, Bank A would need to increase revenues by about 40% to match Bank B’s efficiency ratio. However, if Bank A had attacked both sides of the equation, increasing fees while decreasing expenses, the impact would have been far greater.
As the table below illustrates, movements across both revenue and expenses can have a much greater impact than just moving the bar on either expenses or income. Generally though, lowering the expense portion alone without impacting revenue will provide greater a decline in the Efficiency Ratio than a similar increase in revenue. As the table below shows, increasing revenue by 20% and keeping costs flat results in a ratio of .76 versus reducing expenses by 20% but keeping revenue flat, yields a ratio of .73. However, best practice organizations typically try to impact both costs and revenues to maximize their efficiency gain.
Table 1 – Efficiency Calculations Under Different Scenarios
Tools to Help Improve Operational Efficiency
Now that we have some baseline information on Efficiency Ratios and their importance to the bank, we need try and understand ways in which organizations improve their operational efficiencies or perhaps what tools might be available to help drive this. There are a number of ways in which an organization can improve their efficiency and a combination of tools is often needed to achieve the organization’s goals. The tools most commonly used are:
• Benchmarking: Use of standardized data to compare one FI against one or more FI’s in order to understand whether or not our FI is competitive against others in the database or against specific peers. Often times the data gathered is very specific and requires a strong definition and agreement among all participants in order to prevent or minimize bias in the data sets. Benchmarks can be for one very specific area of the organization such as Branch operations or can be built across the broader organization. The data is often for a specified moment in time or a specific time period. This tool is most effective when it can be repeated over time and then used to build a strong profile of the organizations measured. The problem is that not all organizations will participate every time a benchmark might be offered sometimes making it difficult to accurately track from one year to the next. There may also be bias if one type of organization versus another is more prevalent. For example, if a benchmark of banks is performed on branch operations (e.g. platform and teller) in the community bank market but a large bank with thousands of branches suddenly has data in the study database, the data can become skewed and difficult to track. Benchmarks can also be very useful in helping an organization establish better tracking across processes. Benchmarks may or may not include best practice recommendations (e.g. best performers are analyzed as to why they have those attributes and that data is shared across participants).
Performance Management
Some might refer to this as managing by the numbers. While all organizations do performance management in terms of annual or more often reviews of their staff, very few organizations take it to another level whereby all aspects of the operations are managed. In some organizations, this is manifested in some kind of quality control program where most of the measurements occur around some form of quality statistic or another. Number of errors per account or call abandon rate in the call center or some other key statistic about the quality of the organization. However, there are hundreds of measurements an organization can utilize including financial, production, and quality metrics. Managing by the numbers can be difficult if an organization puts too many statistics together making for data overload. Organizations that deploy this method usually stick to a finite number of metrics in each function with targets and goals set for each of the functions. Finding the right statistics to track is often very difficult and can take some trial and error before an organization gets it right.
Lean
Lean was originally developed by Toyota for managing production lines in its automobile factories. And about 10 – 15 years ago, service organizations began to adopt the principles of lean and apply them to their own organizations. Like performance management, lean is very much focused on the numbers and metrics of the operation but with a strong voice of the customer aspect to it. Lean in a service environment always places the voice of the customer in the center so that everything we do or work on has a strong customer service focus to it. We also define our customers as both internal and external customers. Through its concepts, lean helps organizations build a stable operating platform such that the organization has predictable and repeatable outputs which can be used anywhere in the organization from the customer call center to relationship management. An organization then builds a strong SOP or standard operating process environment where managers and coaches regularly observe their staff to measure and manage to the SOP. Production managers are forced to have interaction with their staff and they must spend about 50% of their time managing the production floor rather than in their offices or meetings. Next, lean introduces the concept of transparency and this is often reflected by organizations through the use of white boards that will highlight issues, production, current statistics or other important information. The white boards also form the basis for daily huddles by team members to discuss the anticipated activities of the day and plan accordingly. Lastly, lean has a component of a desire to have continuous improvement throughout the organization.
Six Sigma
Another carryover to the services business from manufacturing, Six Sigma was invented by Motorola Corporation in the 1990’s. Motorola who was already a big proponent of TQM and had adopted a very strong quality management program but felt that they needed to do more. Shortly after Motorola introduced the concept, it was quickly adopted by GE. Basically six sigma is a methodology whereby you measure how many defects per million instances of something. To reach six sigma, the acceptable error rate is 3.4 defects per million. Six Sigma utilizes a concept referred to as DMAIC (Design, Manage, Analyze, Implement, and Control) as the method to achieve its goals. However, in order to do this, processes and projects have to be managed by specially trained individuals who become first a green belt and later a black belt in the process. Of course these groups and their respective projects are managed by master black belts. Like Lean, Six Sigma has proven to be a very valuable tool for organizations willing to invest in the training and perform the detailed analysis it requires. It primarily differs in that it looks for creating perfection in everything you do therefore the voice of the customer is not talked about with regards to Six Sigma. Perfect processes lead to delighted customers. There is also a variation of both lean and six sigma referred to as Lean Six Sigma that does try to take the customer aspects of lean and deploy them with the rigors of six sigma.
Best Practices Review
This is simply a review of the various operational components of the organization by an industry expert or consultant who brings a sense of what other companies do in similar situations and may utilize one or more of the above tools to do a diagnostic and analysis to help an organization jump start its operational efficiency process.